All projects

SalesML

E-commerce revenue forecasting, customer segmentation, and cold-start planning on Brazil's Olist dataset.

AI & Data

  • python
  • typescript
  • scikit-learn
  • pandas
  • flask
  • react
  • tailwind
  • recharts
  • joblib
  • uv
SalesML on a laptop
SalesML on a tablet
SalesML on a phone
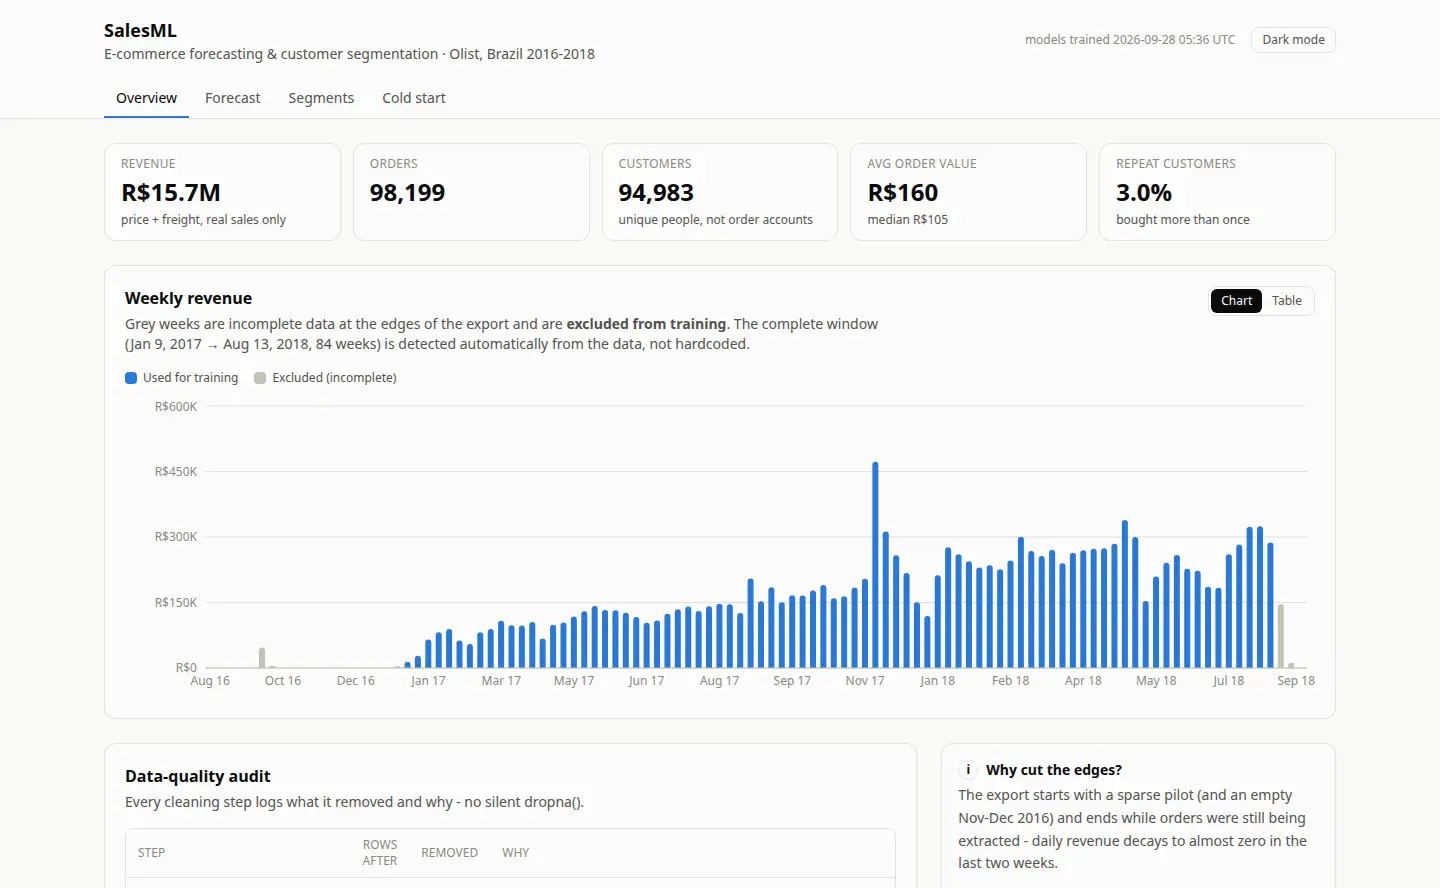
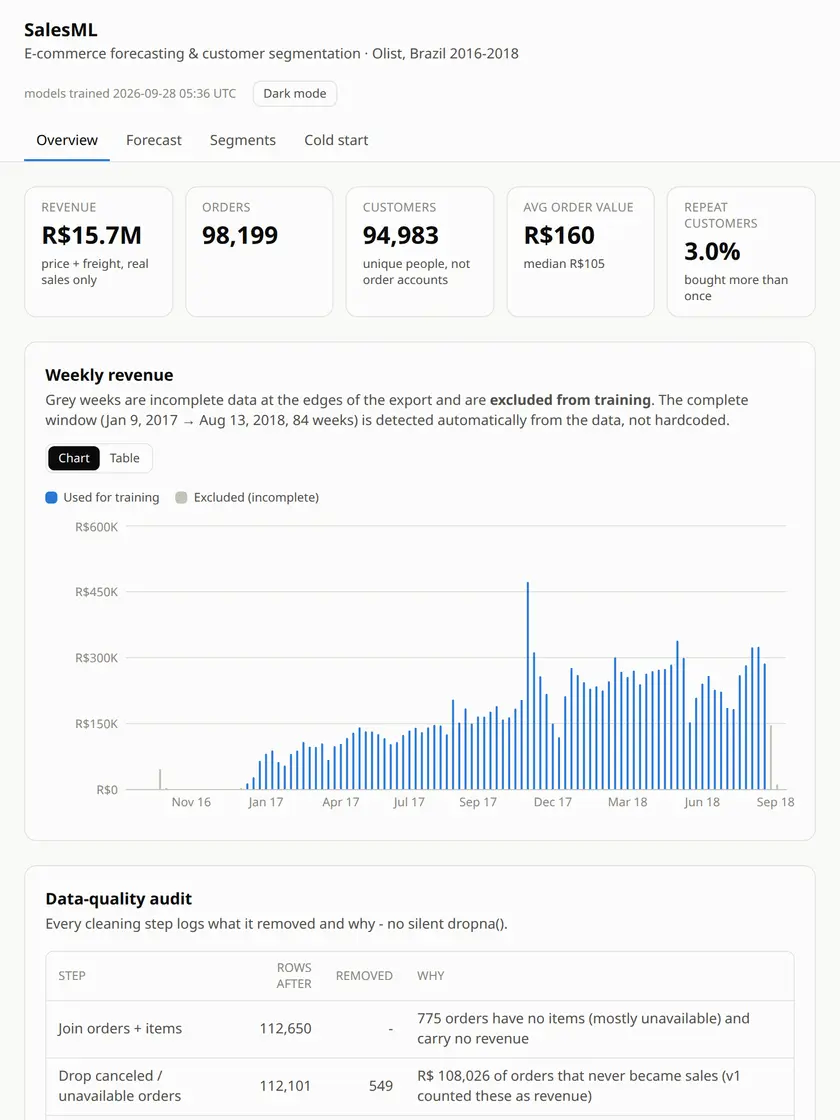
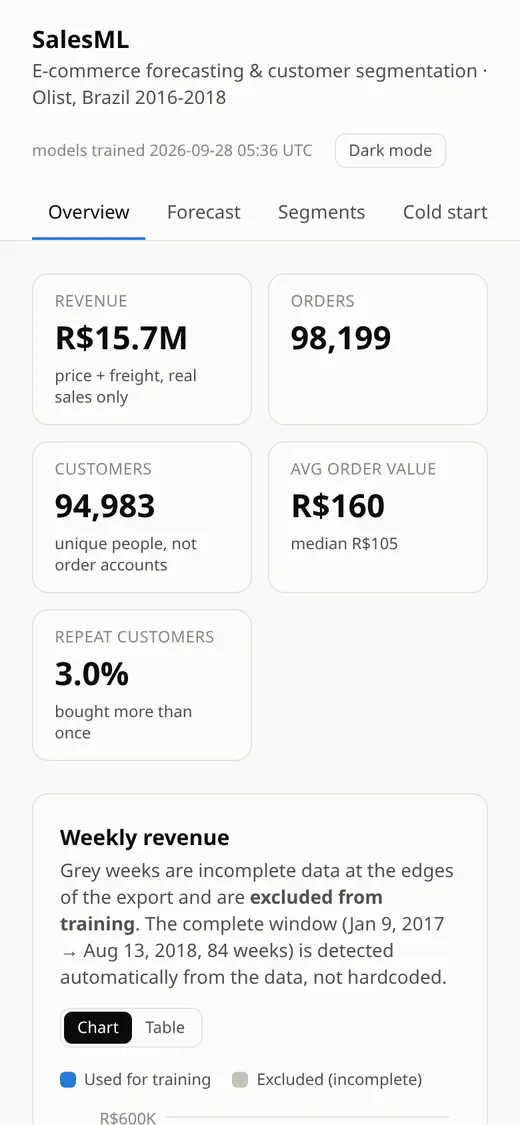
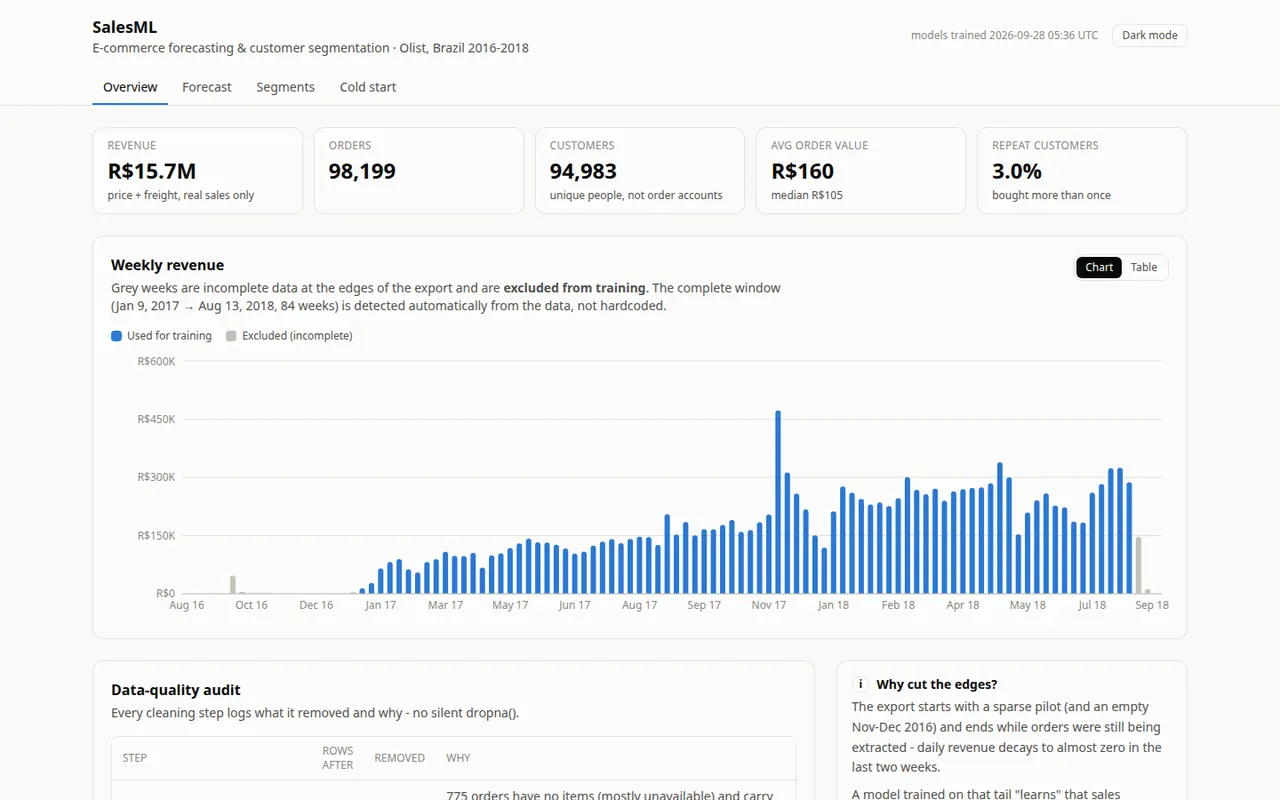
The SalesML interface.

Overview

SalesML is an end-to-end analytics project built on the public Olist Brazilian e-commerce dataset (2016–2018). A reproducible Python pipeline cleans and audits order data, forecasts weekly revenue, segments customers by purchasing behavior, and serves the saved models through a Flask API to a React dashboard. It also includes a cold-start estimator for stores without sales history. The project emphasizes honest evaluation and communicating uncertainty instead of presenting model output as certainty.

Screens

  • SalesML, the overview screen
    Overview KPIs, weekly revenue and the cleaning audit, data quality first
  • SalesML, the forecast screen
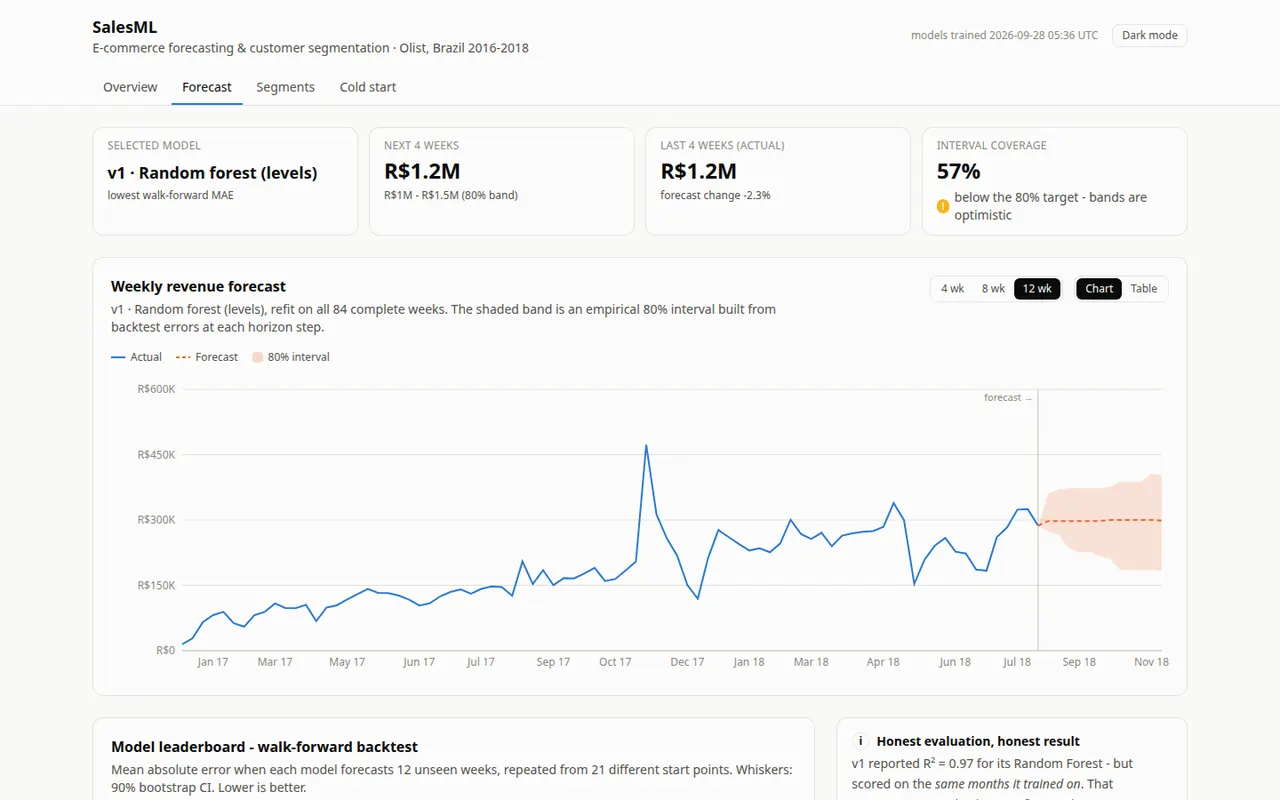
    Forecast A 12-week forecast with its 80% band and the model leaderboard
  • SalesML, the segments screen
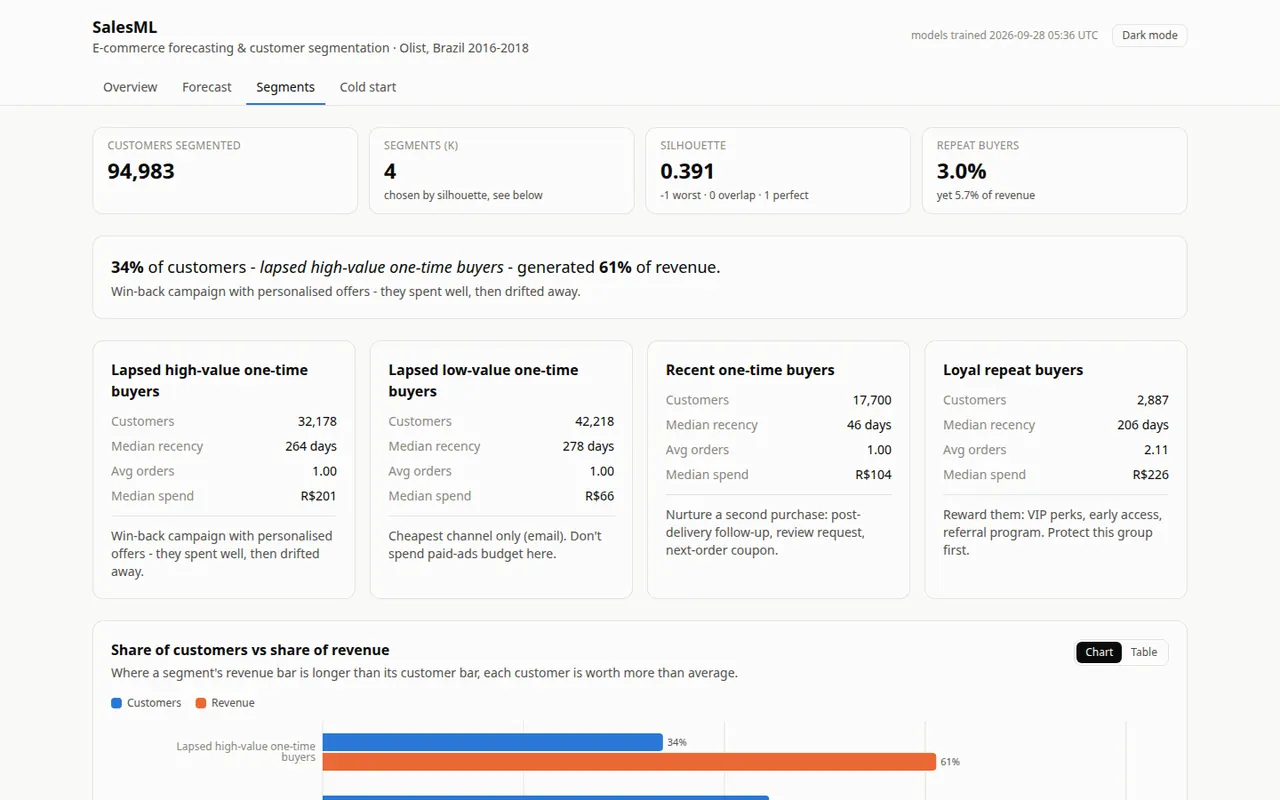
    Segments Four RFM segments, each with the action it calls for
  • SalesML, the cold start screen
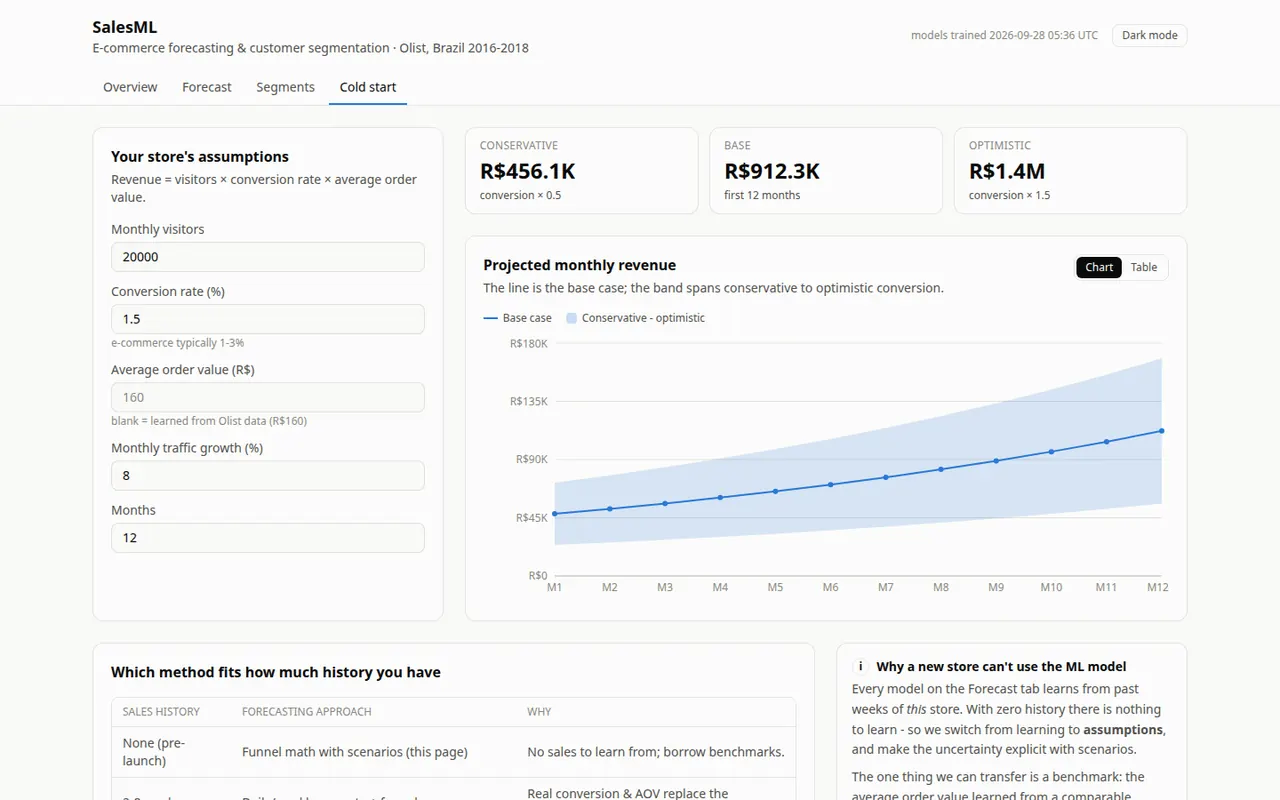
    Cold start Funnel scenarios for a store with no sales history yet
  • SalesML, the dark mode screen
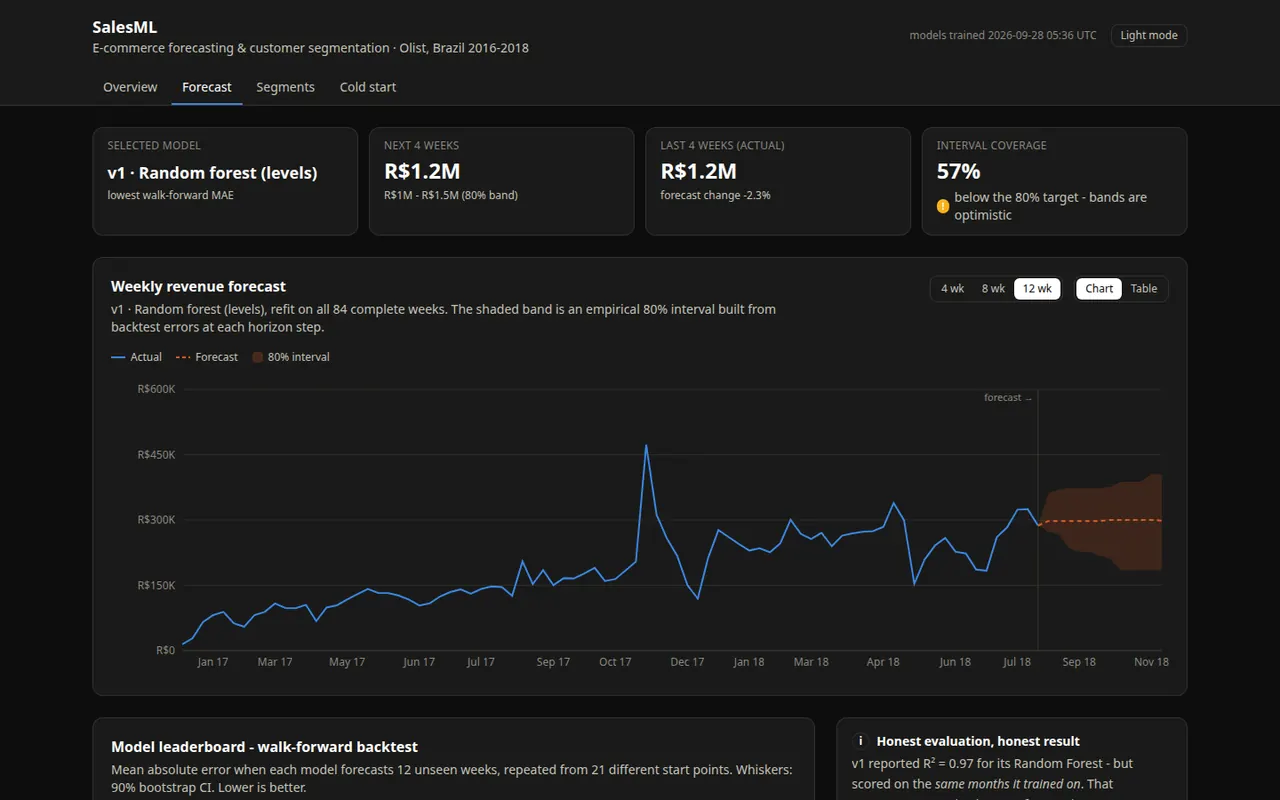
    Dark mode Separate light and dark palettes, both checked for colour-blind safety

Key features

  • Overview dashboard reports revenue, orders, unique customers, average order value, repeat-customer rate, and the usable data window.
  • Cleaning audit shows which rows were removed, why they were removed, and which extreme prices were retained rather than silently discarded.
  • Forecast view compares nine baseline, statistical, and machine-learning approaches and presents up to 12 weeks of predictions with uncertainty bands.
  • Walk-forward backtesting evaluates forecasts on later time periods, with model comparisons, error metrics, and confidence intervals.
  • Customer segmentation groups shoppers using recency, frequency, and monetary value, then pairs segments with suggested actions.
  • A customer-classification form applies the saved segmentation pipeline to new RFM values and reports segment affinity as a distance-based score.
  • Cold-start scenarios estimate revenue from visitors, conversion rate, average order value, and optional traffic growth when a store has no history.
  • Dashboard charts can switch to tables, and the interface includes separate light and dark palettes.

Engineering highlights

  • Uses 98,199 orders and 94,983 unique customers; automatically selects 84 complete weeks from 2017-01-09 through 2018-08-13 and excludes incomplete edges.
  • Compares nine forecasting methods over 21 expanding-window folds with a 12-week horizon, avoiding random splits that would leak future information.
  • The README reports best-model MAE of R$40.0k per week (about 17.5% MAPE), 9.7% better than the naive baseline on this historical dataset.
  • The top six model confidence intervals overlap, so the README does not claim a clear winner over a four-week moving average.
  • Prediction intervals reached 57% coverage against an 80% target; the dashboard surfaces that calibration shortfall rather than hiding it.
  • RFM preprocessing and KMeans are persisted together in a scikit-learn Pipeline using joblib; training is separate from API serving.
  • The backend uses Python, pandas, scikit-learn, Flask, and uv; the frontend uses React, TypeScript, Tailwind CSS, Vite, and Recharts.

Challenges and approach

The source export contains partial periods and canceled or unavailable orders that can distort revenue and forecasts.

The pipeline records a cleaning audit, excludes non-sales, validates amounts, and detects the complete weekly history from the data instead of hard-coding its date range.

In-sample evaluation made the earlier Random Forest result look much stronger than its performance on unseen periods.

The updated pipeline compares nine models with expanding-window walk-forward backtesting and a naive baseline; it reports the overlapping confidence intervals and known limitations.

A new store has no sales history for a trained forecasting model to use.

The cold-start view uses explicit visitor, conversion, and average-order-value assumptions to show low/base/high scenarios rather than pretending a history-based forecast is possible.